Line & area
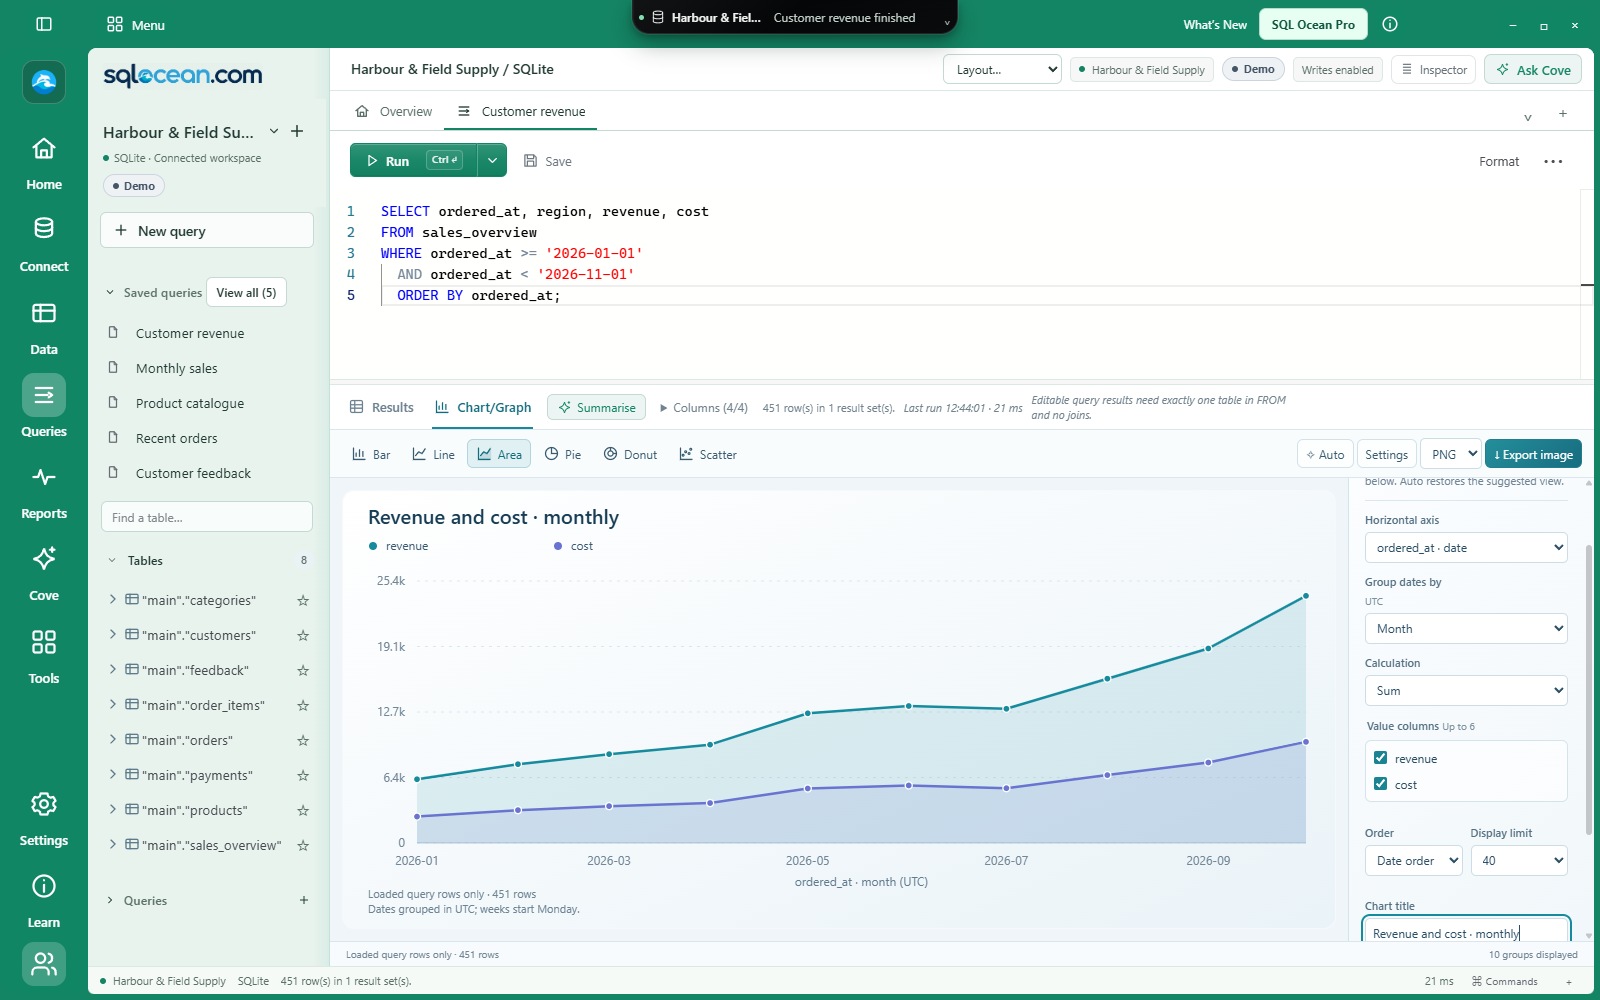
Follow changes over time. Compare measures such as revenue and cost on the same chart.

CHARTS & GRAPHS / SEE THE PATTERN
Move from returned rows to a chart in the same workspace. Explore a trend, compare categories and take the picture into your next conversation.
Current development features · Public download coming soon
 View full size ↗
SIX WAYS TO SEE IT
Results and Chart/Graph subtabs are available in query results and Browse data. Auto suggests a starting point from the columns you have loaded.
Follow changes over time. Compare measures such as revenue and cost on the same chart.
Compare cities, product categories or customer totals. Sort the values to bring the largest differences into view.
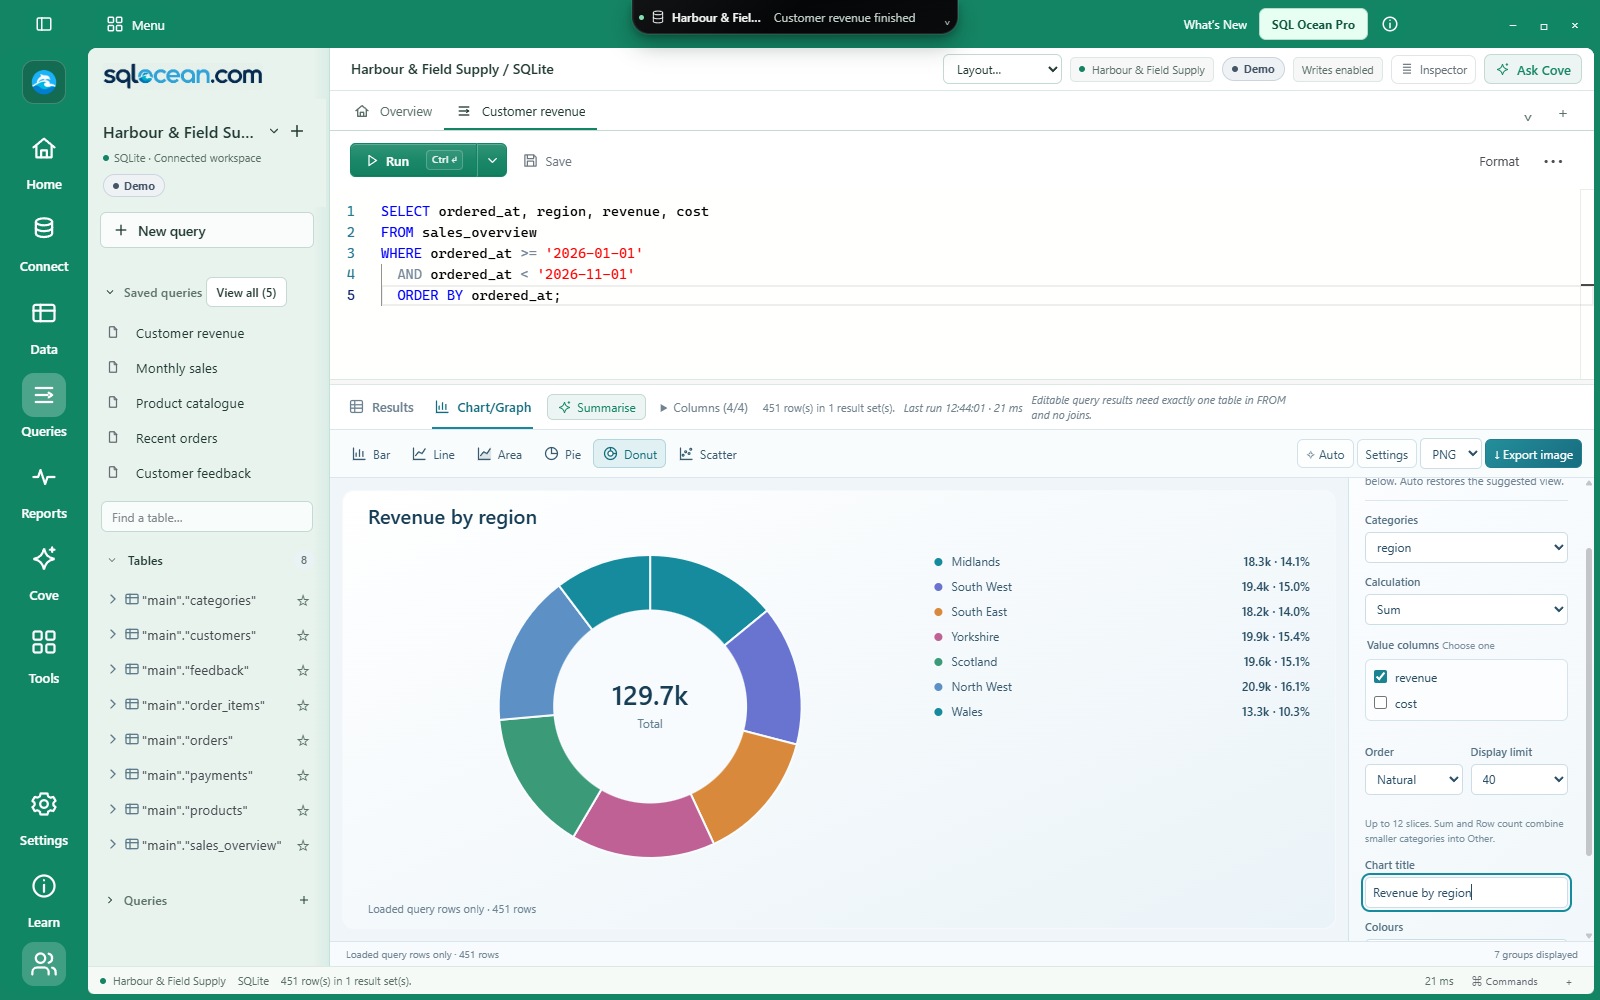
Show how a total is divided between categories. Smaller categories can be grouped into Other.
Explore the relationship between two numeric columns, such as quantity and order value.
YOUR COLUMNS. YOUR CALCULATION.
Choose the horizontal axis and value columns, then adjust the calculation, ordering, display limit, title and colour palette.
 View full size ↗
Count rows, or use sum, average, minimum or maximum. Supported multi-series views can show up to six value columns.
Group timestamps by day, week, month, quarter or year. Date grouping uses UTC.
Chart choices belong to their query or table view. Returning to Results retains the grid, and detached query windows retain chart settings.
FROM THE WORKSPACE TO THE NEXT CONVERSATION
Save a PNG for a document or presentation, or an SVG for a scalable image. Choose the filename and location in the native Save dialog.
Charts use the loaded query results or filtered table page, including current edits. They do not run an extra query or automatically read the entire database. Coverage labels show row counts and truncated results.
Free for everyday SQL. 40 days of Pro included automatically for new Windows users. Optional Pro is £7.50/month.
Check download availability ↗KEEP EXPLORING