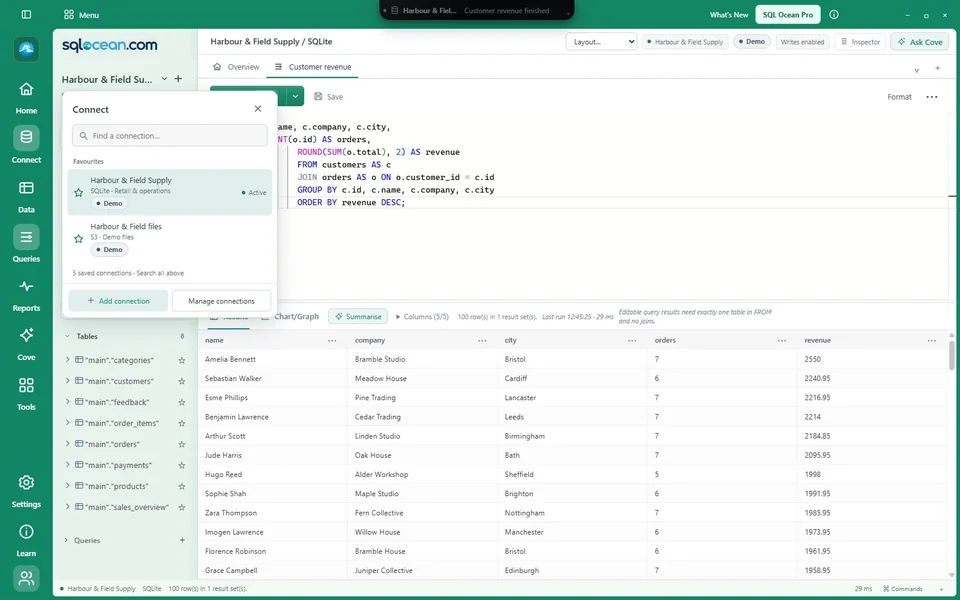
Choose your sources
Discover report candidates from the database, select the tables and date columns, and choose what to place near the top.
REPORTS / YOUR DATA, IN PLAIN ENGLISH
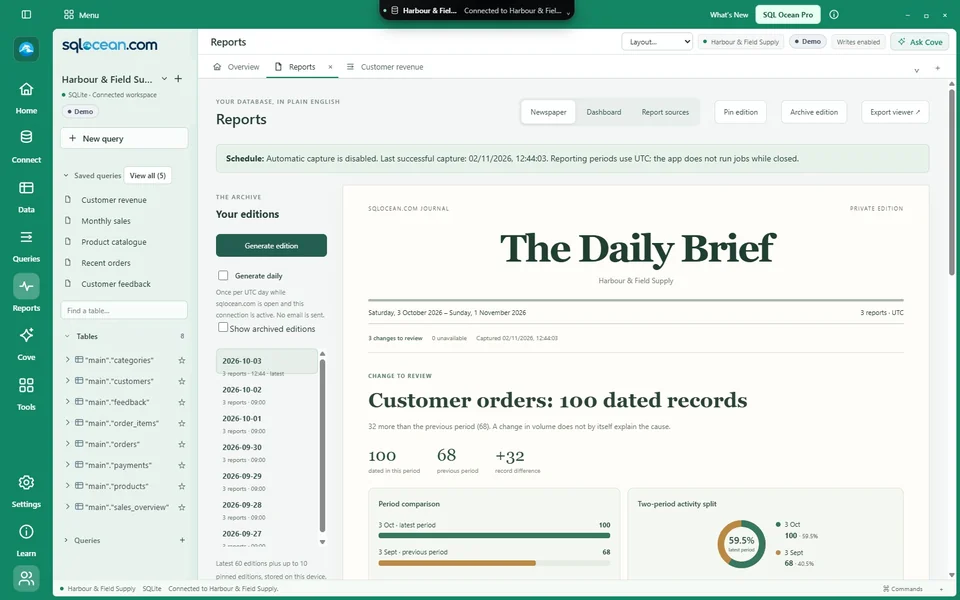
Choose the sources that matter, capture an edition and review the changes. Read it as a newspaper or switch to the dashboard.
Current development features · Public download coming soon
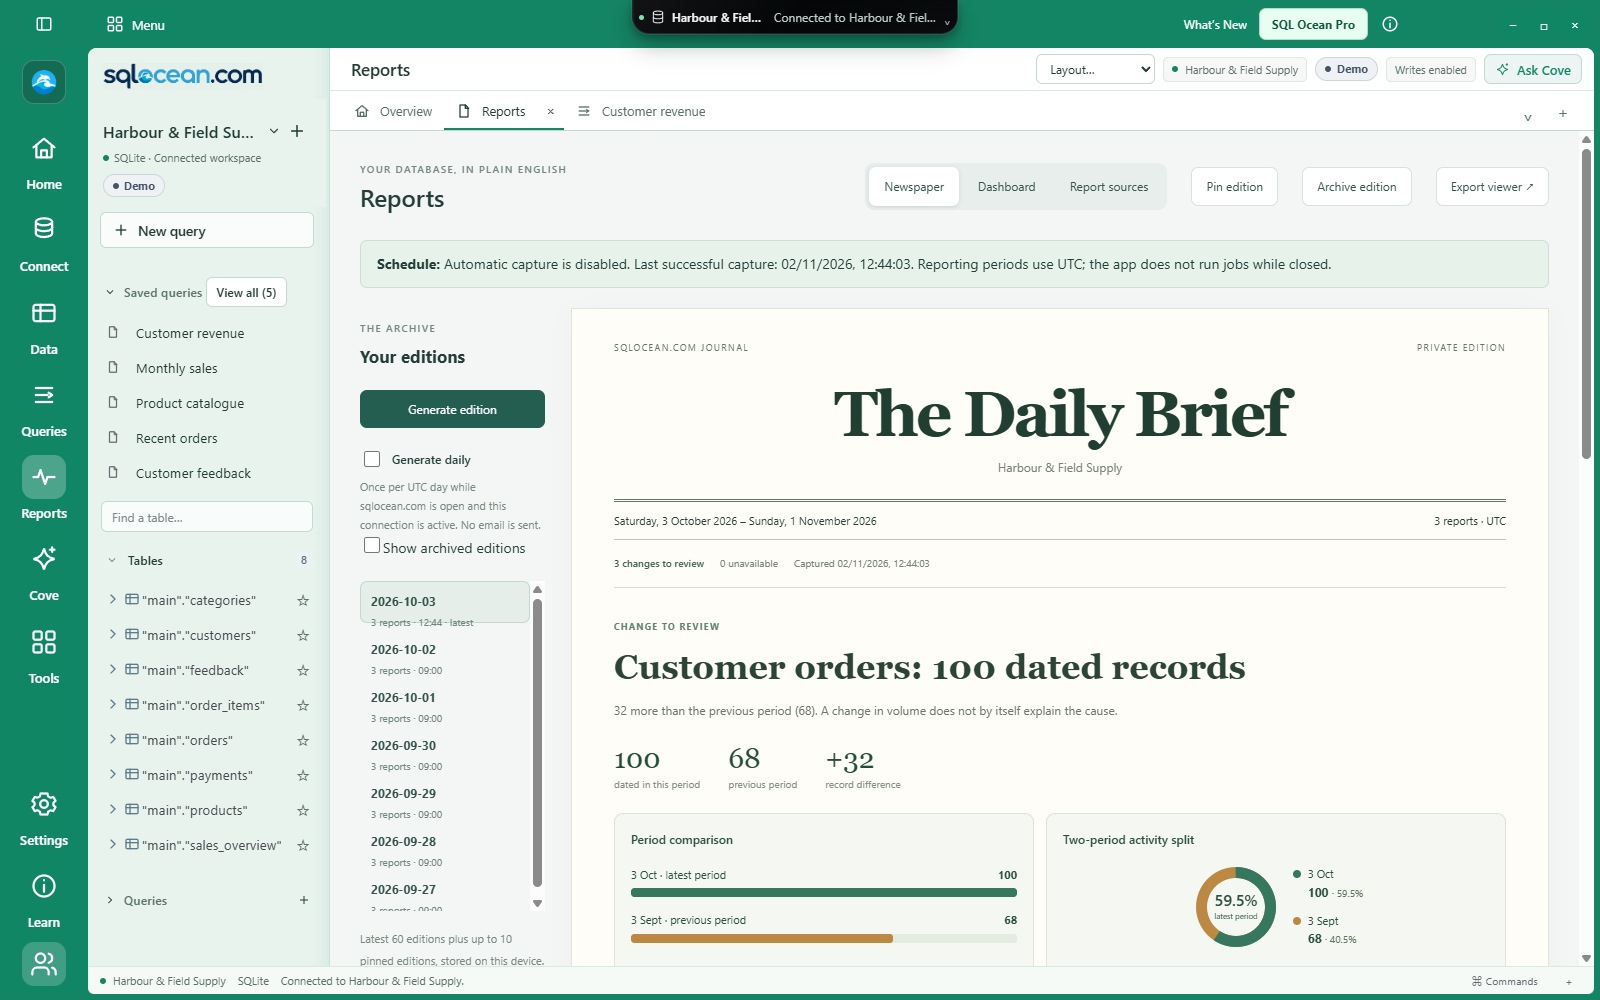 View full size ↗
A WINDOW ON YOUR WORK
Compare one, seven or thirty complete UTC days with the preceding period of the same length. Each reporting window keeps its own trend history.
Discover report candidates from the database, select the tables and date columns, and choose what to place near the top.
See source information and how a figure was measured. Tables without a selected date field show a total at capture time.
Set count and percentage thresholds for highlighting changes. Open the dashboard for a different view of the same edition.
A RECORD YOU CAN RETURN TO
Save editions locally, compare them with earlier captures, pin useful editions and archive others without losing access.
ON YOUR SCHEDULE
Reports shows whether automatic capture is enabled and when the last successful capture completed.
Automatic daily capture requires Reports to be open on the active connection while SQL Ocean is running. It does not run while the app is closed or send a daily email. Reports is a Pro feature for supported PostgreSQL, MySQL, SQLite and SQL Server connections. Provider permissions and query limits apply.
Explore charts for individual query results →Free for everyday SQL. 40 days of Pro included automatically for new Windows users. Optional Pro is £7.50/month.
Check download availability ↗KEEP EXPLORING